Profile a query
The query profiler in the Polars Nanook cluster dashboard shows, per query, the timeline, the optimized logical plan, the physical plan with per-node CPU and I/O time, and for distributed queries the stage graph with the data shuffled between stages. It works the same in every deployment. It shows whether a slow query is bound by reading data, by computation, or by shuffling between workers.
Time spent in a distributed query
Query optimization starts with knowing where the query spends its time. Each worker in a distributed query does three things: it reads data, computes on it, and exchanges data with other workers.
Input/Output: Each worker reads its assigned partitions from storage and writes results to a destination. These are typically the first and last activities in the profiler. I/O-heavy queries benefit from more network bandwidth, either from more nodes or from a higher-bandwidth instance type.
Computation: Workers execute the query operations (such as filters, joins, aggregations, etc.) on their local data. CPU and memory usage are visible in the resource overview of the nodes.
Shuffling: Some operations, such as joins and group-bys, require all rows with a given key to be on the same worker. To accomplish this, data is redistributed across the cluster in a shuffle between stages. Within a stage, the streaming engine processes incoming shuffle data as it arrives over the network, so I/O and computation overlap. Shuffle-heavy queries produce large volumes of inter-node traffic, visible as network bandwidth usage in the cluster dashboard and as a high percentage of time spent shuffling in the metrics.
On this page worker and node both mean one machine of the cluster (see the glossary), but node in the physical plan means one operator.
Open a profile
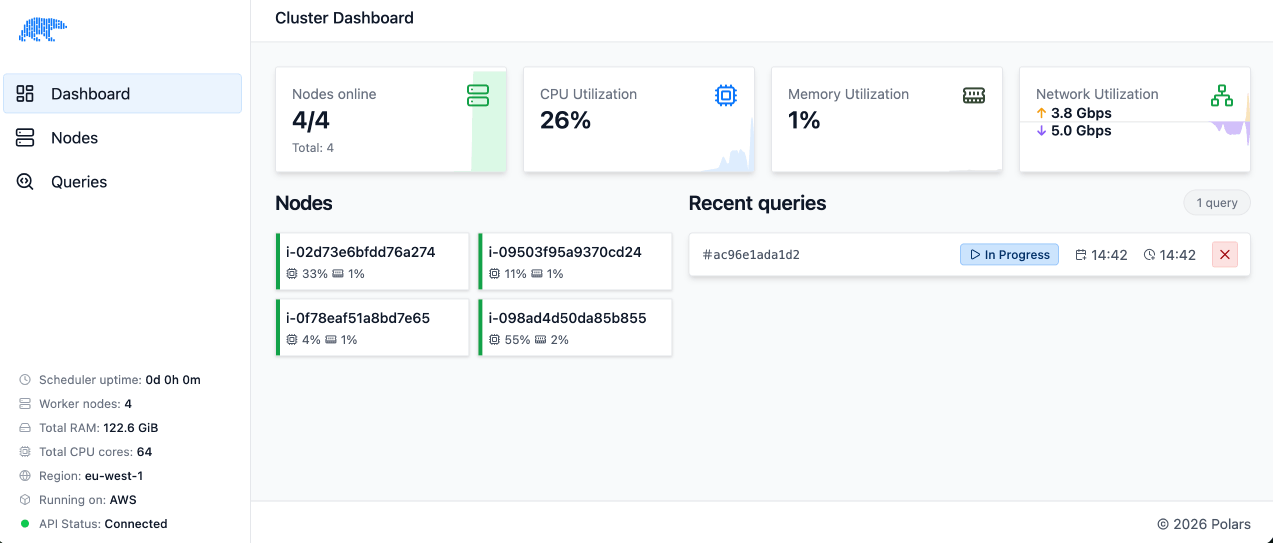
The Queries tab of the workspace in the portal lists the queries of AWS compute, of clusters connected to the Polars control plane and of your own machine.
A cluster you run also lists its queries in the Queries tab of its cluster dashboard, which the observatory serves on port 3001 of the scheduler node. See Connect to a cluster you run to expose it. An air-gapped cluster has only this dashboard. Selecting a query opens its details, with metrics such as the percentage of time spent shuffling and, per stage, the workers' CPU and memory usage, both while it runs and after it completes.
Single-node query
The first example is PDS-H Q1 on the 10 GB PDS-H dataset running on a single node (8 vCPU and 8 GB).
Try it: Single node query
A query runs on a single node when marked as follows:
query.remote(ctx).single_node().collect()
The query then runs on a single worker, which simplifies query execution and needs no shuffle
of data between workers. Copy and paste the example below after creating ctx to explore the
feature. The data comes from the public datasets. The
compute context sets the cluster size on AWS. On a cluster you run, pass a
cluster context instead.
import polars as pl
import polars_nanook as pn
from datetime import date

ctx: pn.ComputeContext | pn.ClusterContext

lineitem = pl.scan_parquet(
    "s3://polars-cloud-samples-us-east-2-prd/pdsh/sf10/lineitem.parquet",
    storage_options={"request_payer": "true", "aws_region": "us-east-2"},
)
var1 = date(1998, 9, 2)

(
    lineitem.filter(pl.col("l_shipdate") <= var1)
    .group_by("l_returnflag", "l_linestatus")
    .agg(
        pl.sum("l_quantity").alias("sum_qty"),
        pl.sum("l_extendedprice").alias("sum_base_price"),
        (pl.col("l_extendedprice") * (1.0 - pl.col("l_discount")))
        .sum()
        .alias("sum_disc_price"),
        (
            pl.col("l_extendedprice")
            * (1.0 - pl.col("l_discount"))
            * (1.0 + pl.col("l_tax"))
        )
        .sum()
        .alias("sum_charge"),
        pl.mean("l_quantity").alias("avg_qty"),
        pl.mean("l_extendedprice").alias("avg_price"),
        pl.mean("l_discount").alias("avg_disc"),
        pl.len().alias("count_order"),
    )
    .sort("l_returnflag", "l_linestatus")
).remote(ctx).single_node().collect()
Logical and physical plan
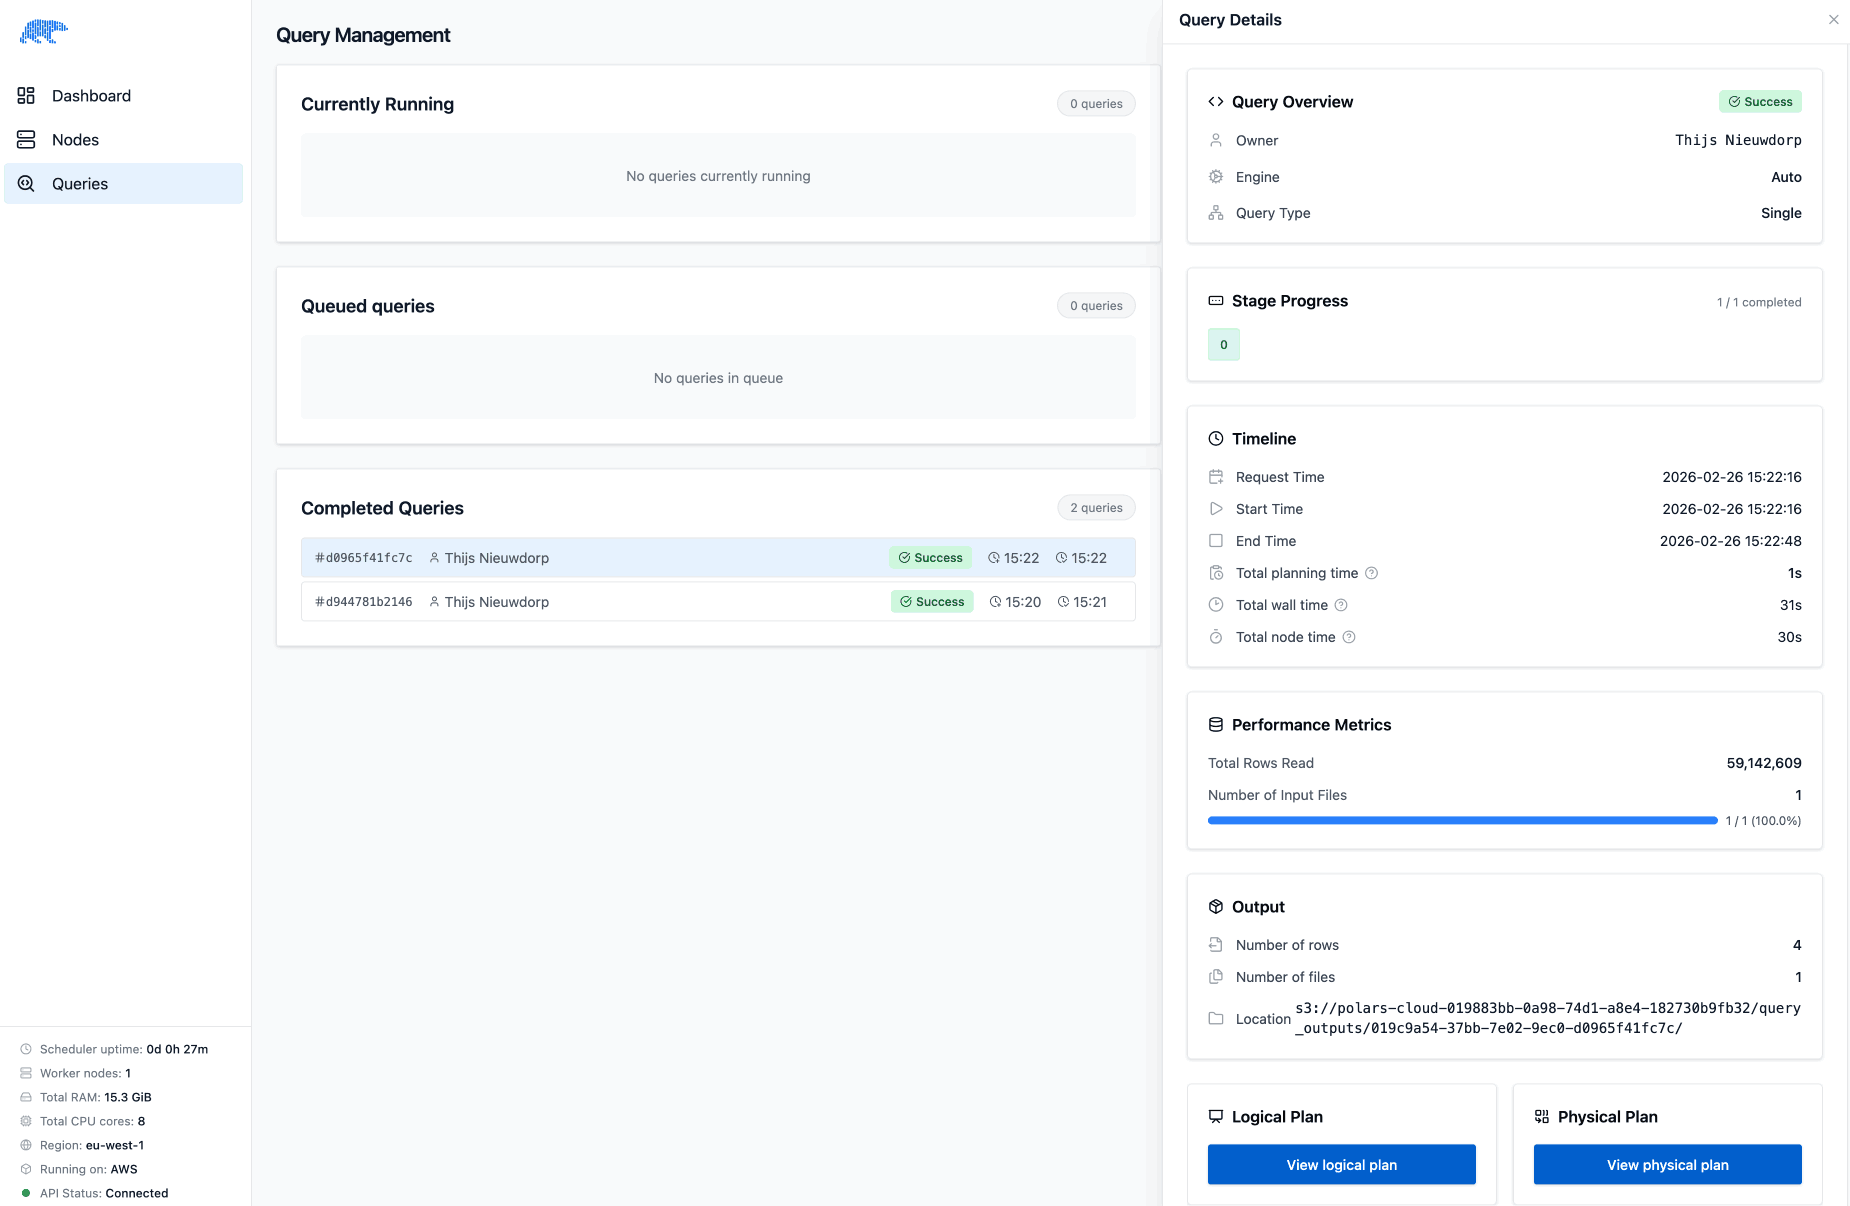
The "Queries" tab lists the queries, and selecting one opens its details. The timeline shows when the query started and ended, and how long planning and running the query took. The query consists of a single stage, because it runs completely on a single node.
The Logical Plan and Physical Plan cards of the query details open the optimized logical plan and the physical plan:
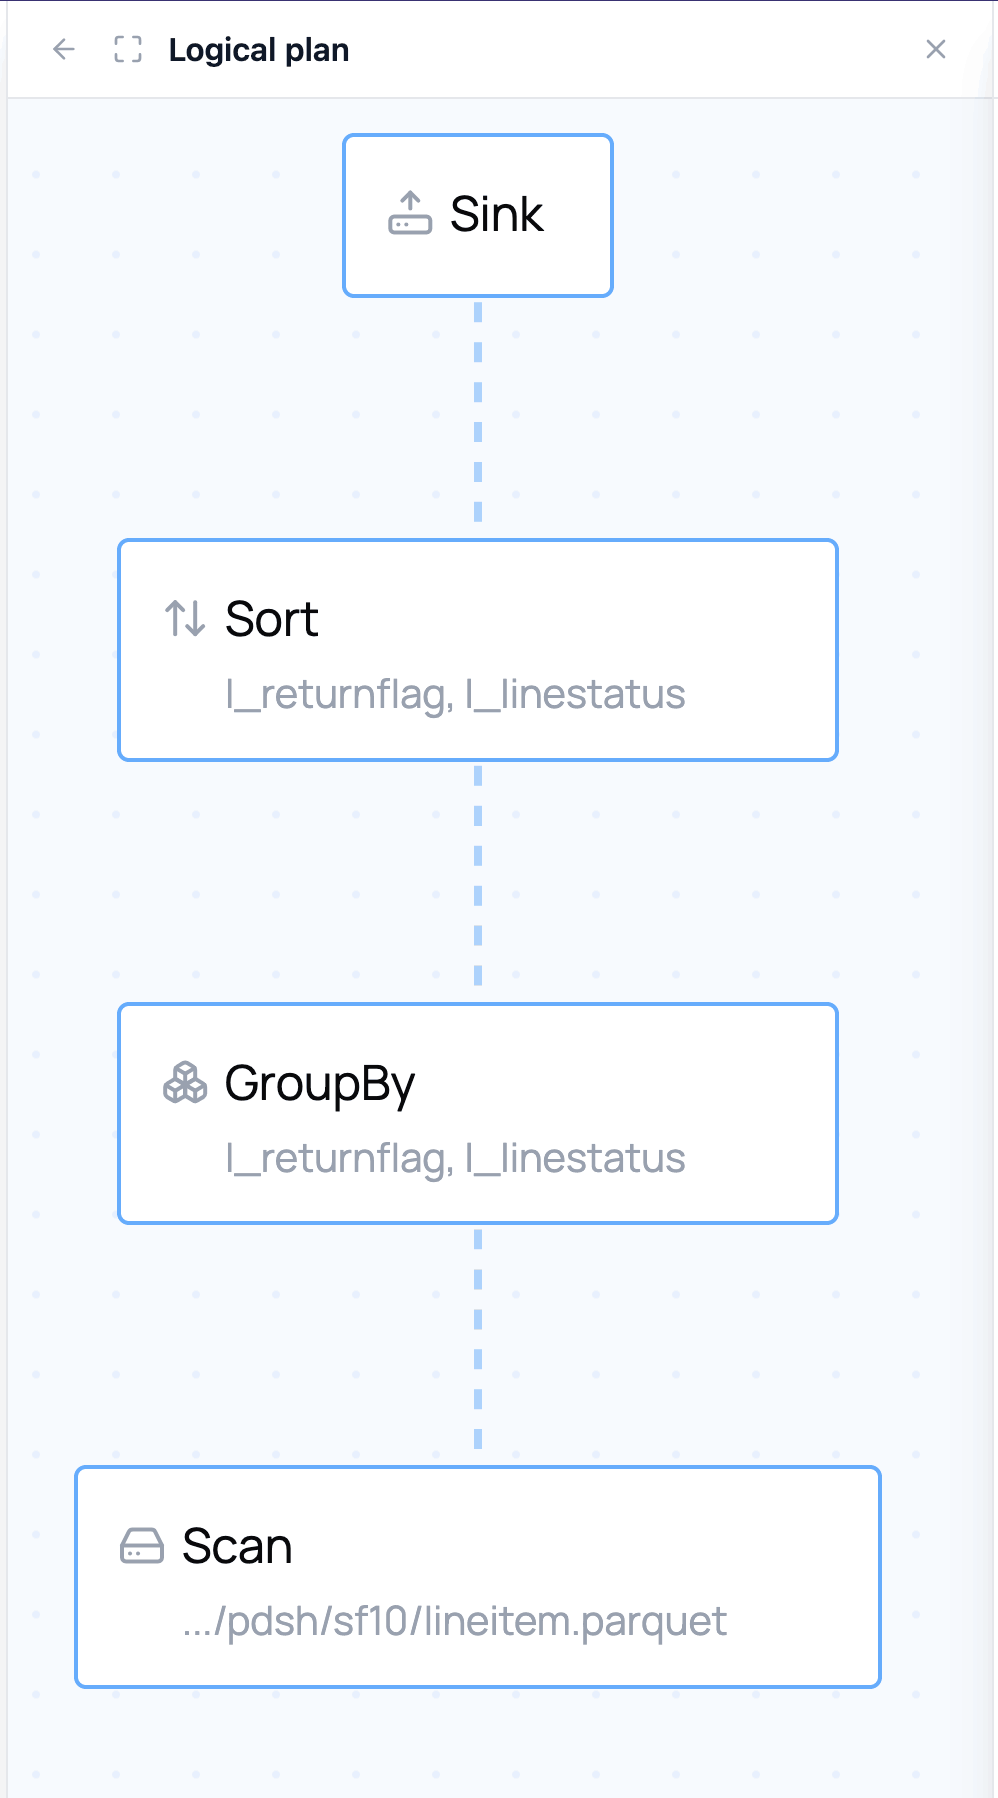
The logical plan is a graph representation that shows what the query does and how it has been optimized. Clicking a node in the plan opens the details of the operation it performs:
The physical plan shows how the engine executes the query: the concrete algorithms, operator implementations, and data flow chosen at runtime.
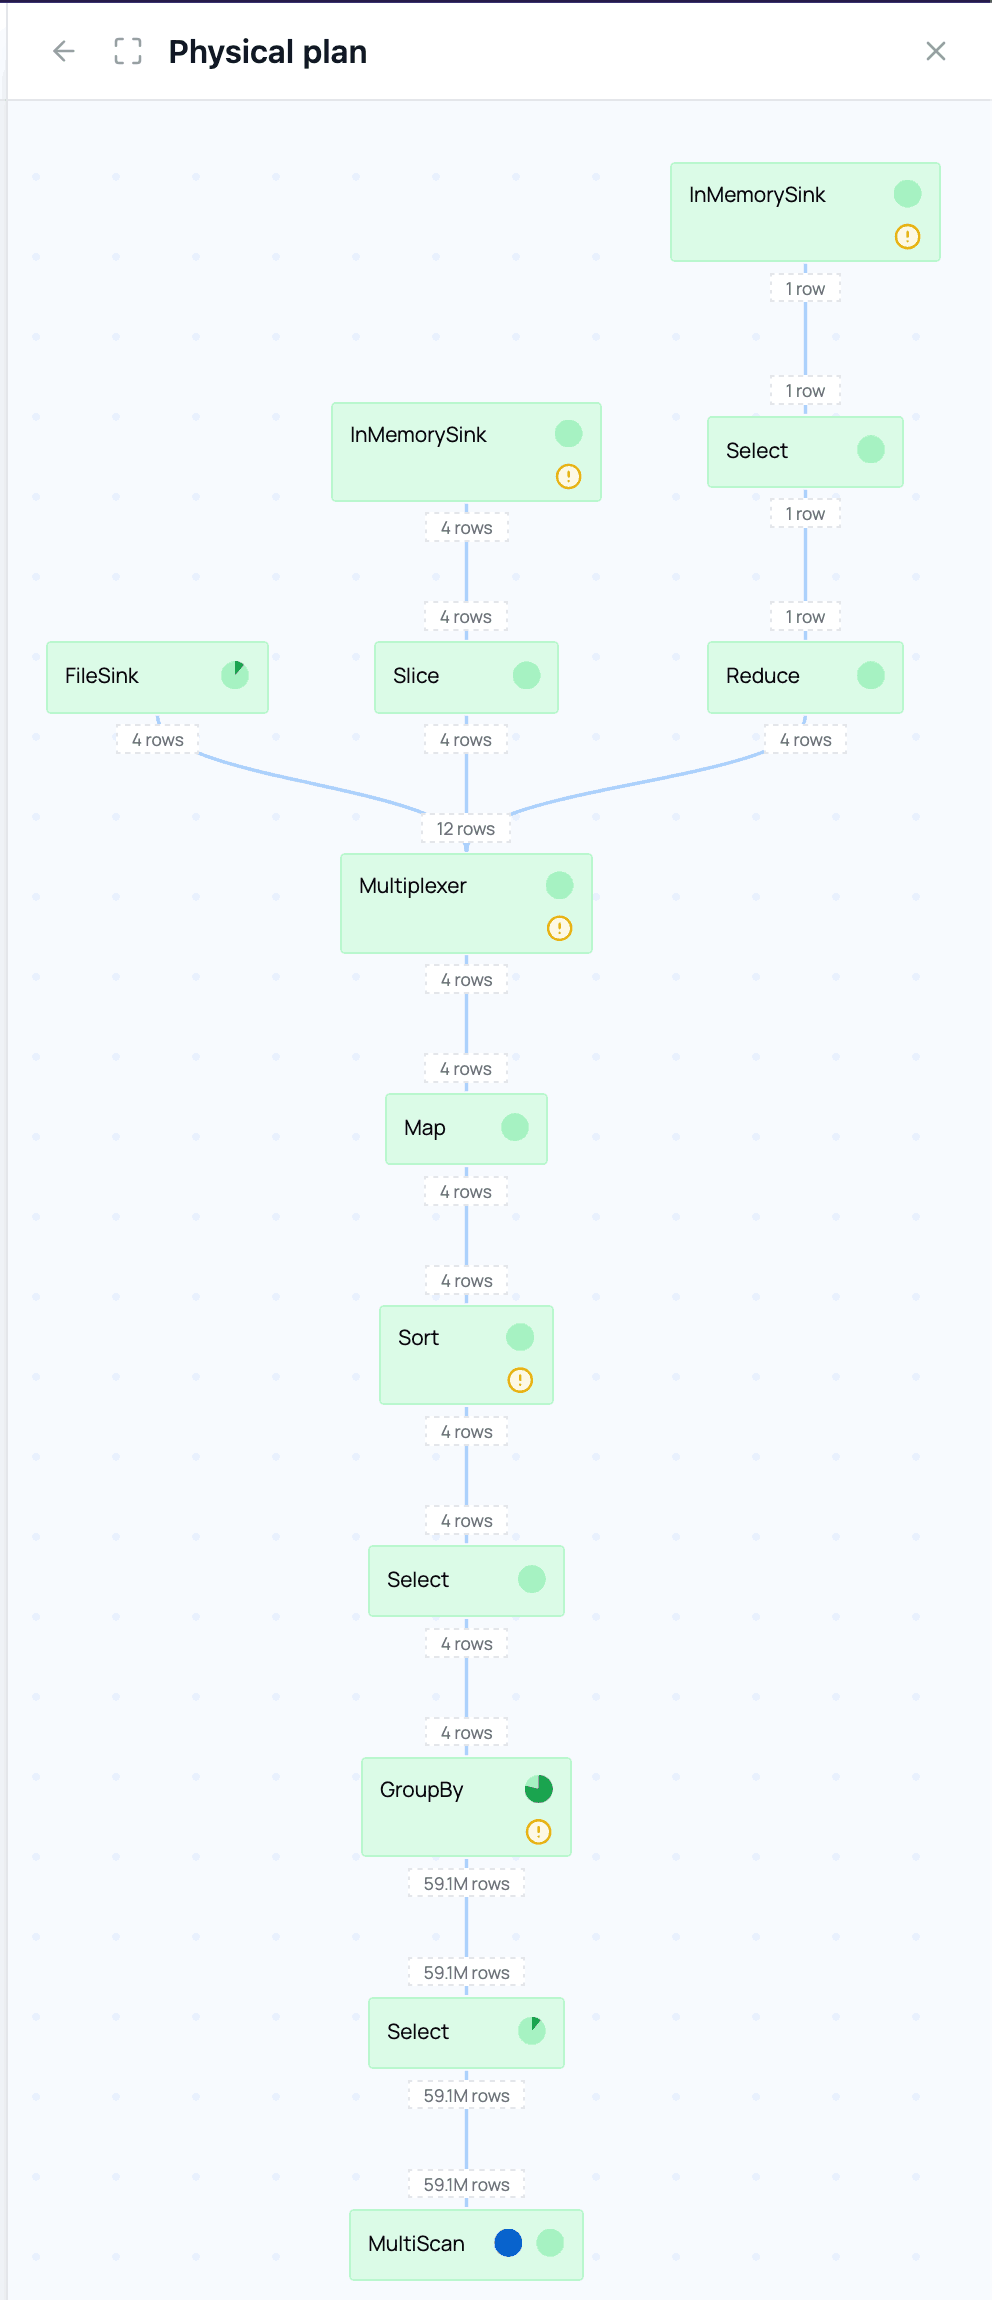
While the query runs and after it has finished, additional metrics are available, such as how many rows and morsels flow through a node and how much time is spent in that node. In this example the group by takes particularly long and aggregates an input of 59.1 million rows to 4 output rows:
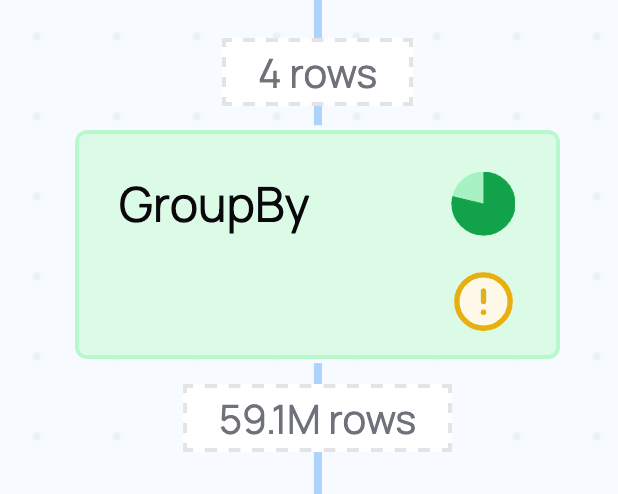
This is expected, because the query performs a list of aggregations, as shown in the node details of the logical plan:
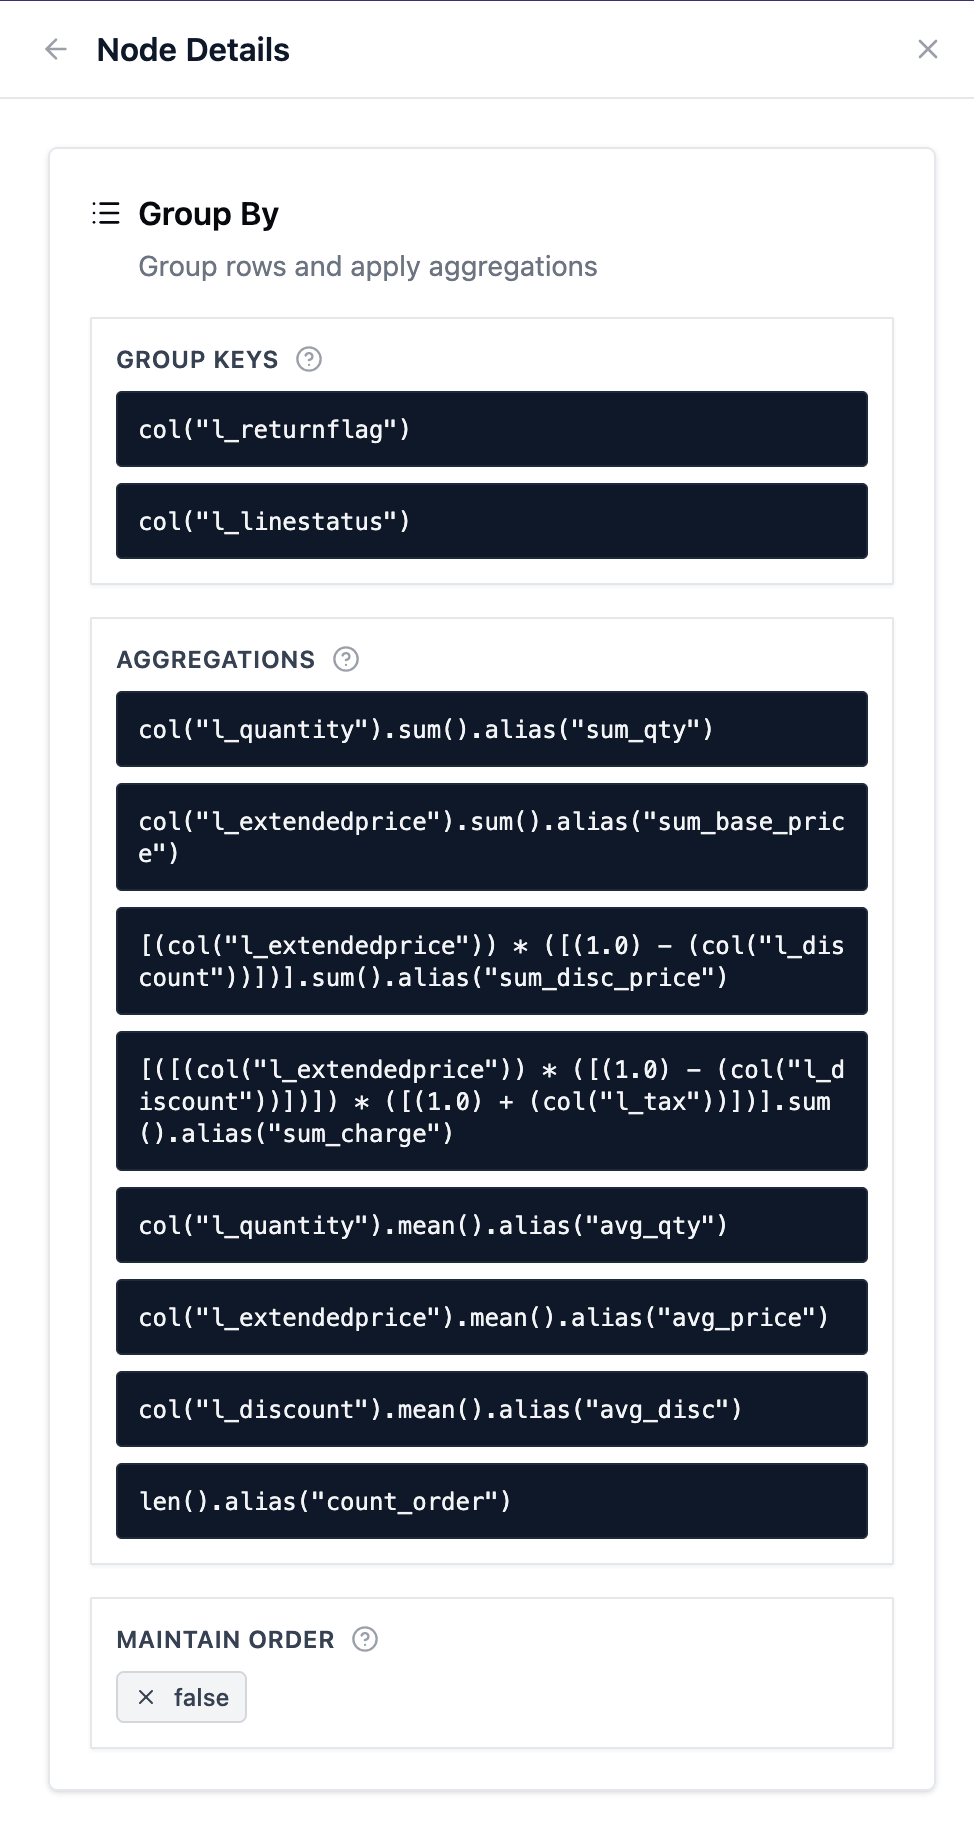
The indication that most time is spent in the GroupBy node matches the expectation for this query.
Indicators on nodes and stages
Nodes in the physical plan or stages in the stage graph can show indicators that point at bottlenecks:
| Indicator | Description |
|---|---|
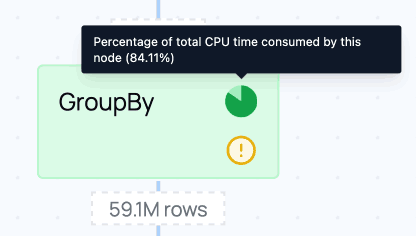 |
Shows which operations took the most CPU time. |
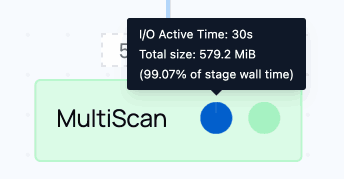 |
Time this node spent on I/O as a percentage of the stage's wall time, helping identify the most I/O-heavy operations. |
 |
The node is potentially memory-intensive because the operation requires keeping state (e.g. storing the intermediate groups in a group_by). |
 |
This stage was executed on a single node. This indicator only appears in distributed queries. |
 |
This operation is currently not supported on the streaming engine and was executed on the in-memory engine. |
I/O and CPU time do not sum to 100%
The I/O time and CPU time percentages shown per node do not sum to the total runtime. This is because execution is pipelined: data is processed as it arrives, so I/O (reading/writing) and CPU (computation) work happens concurrently. As a result, both indicators can be non-zero at the same time for a given node, and their combined total can exceed the total runtime.
Distributed query
The second example is PDS-H Q3 on the 100 GB PDS-H dataset running distributed on 4 nodes
(cluster_size=4, 12 vCPU and 12 GB each). The example code below follows along:
Try it: Distributed query
Distributed is the default execution mode for remote queries in every Polars Nanook deployment. It can also be set explicitly:
query.remote(ctx).distributed().collect()
The distributed engine page covers how distributed execution works.
Copy and paste the example below after creating ctx to explore the feature. The data comes
from the public datasets. The
compute context sets the cluster size on AWS. On a cluster you run, pass a
cluster context instead.
import polars as pl
import polars_nanook as pn

ctx: pn.ComputeContext | pn.ClusterContext


def pdsh_q3(customer, lineitem, orders):
    return (
        customer.filter(pl.col("c_mktsegment") == "BUILDING")
        .join(orders, left_on="c_custkey", right_on="o_custkey")
        .join(lineitem, left_on="o_orderkey", right_on="l_orderkey")
        .filter(pl.col("o_orderdate") < pl.date(1995, 3, 15))
        .filter(pl.col("l_shipdate") > pl.date(1995, 3, 15))
        .with_columns(
            (pl.col("l_extendedprice") * (1 - pl.col("l_discount"))).alias("revenue")
        )
        .group_by("o_orderkey", "o_orderdate", "o_shippriority")
        .agg(pl.sum("revenue"))
        .select(
            pl.col("o_orderkey").alias("l_orderkey"),
            "revenue",
            "o_orderdate",
            "o_shippriority",
        )
        .sort(by=["revenue", "o_orderdate"], descending=[True, False])
    )


lineitem = pl.scan_parquet(
    "s3://polars-cloud-samples-us-east-2-prd/pdsh/sf100/lineitem/*.parquet",
    storage_options={"request_payer": "true", "aws_region": "us-east-2"},
)
customer = pl.scan_parquet(
    "s3://polars-cloud-samples-us-east-2-prd/pdsh/sf100/customer/*.parquet",
    storage_options={"request_payer": "true", "aws_region": "us-east-2"},
)
orders = pl.scan_parquet(
    "s3://polars-cloud-samples-us-east-2-prd/pdsh/sf100/orders/*.parquet",
    storage_options={"request_payer": "true", "aws_region": "us-east-2"},
)

pdsh_q3(customer, lineitem, orders).remote(ctx).collect()
Stage graph
Distributed queries are often executed in stages. Some operations require shuffles to make sure the correct partitions are available to the workers. To accomplish this, data is shuffled between workers over the network. Each stage expands to show the operations it contains and the work happening at each point in the pipeline.
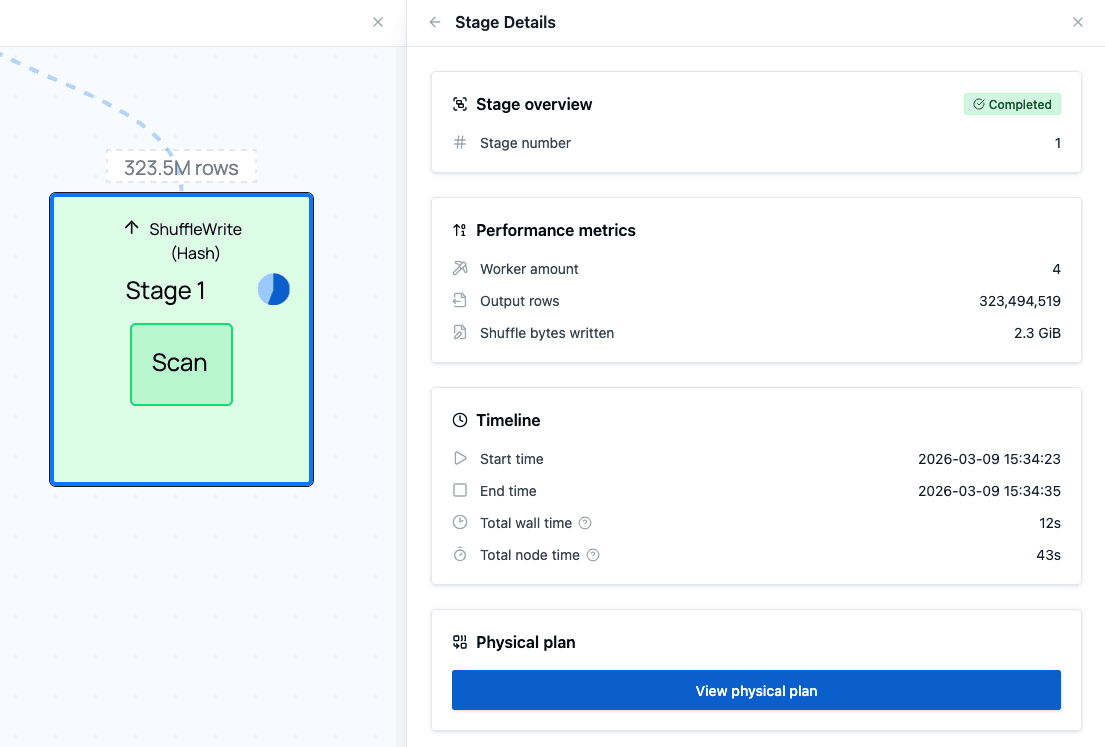
The example query produces the result in the image below. In the stage graph, one of the scan stages at the bottom stands out: its indicator shows a high percentage of total time spent in that stage.
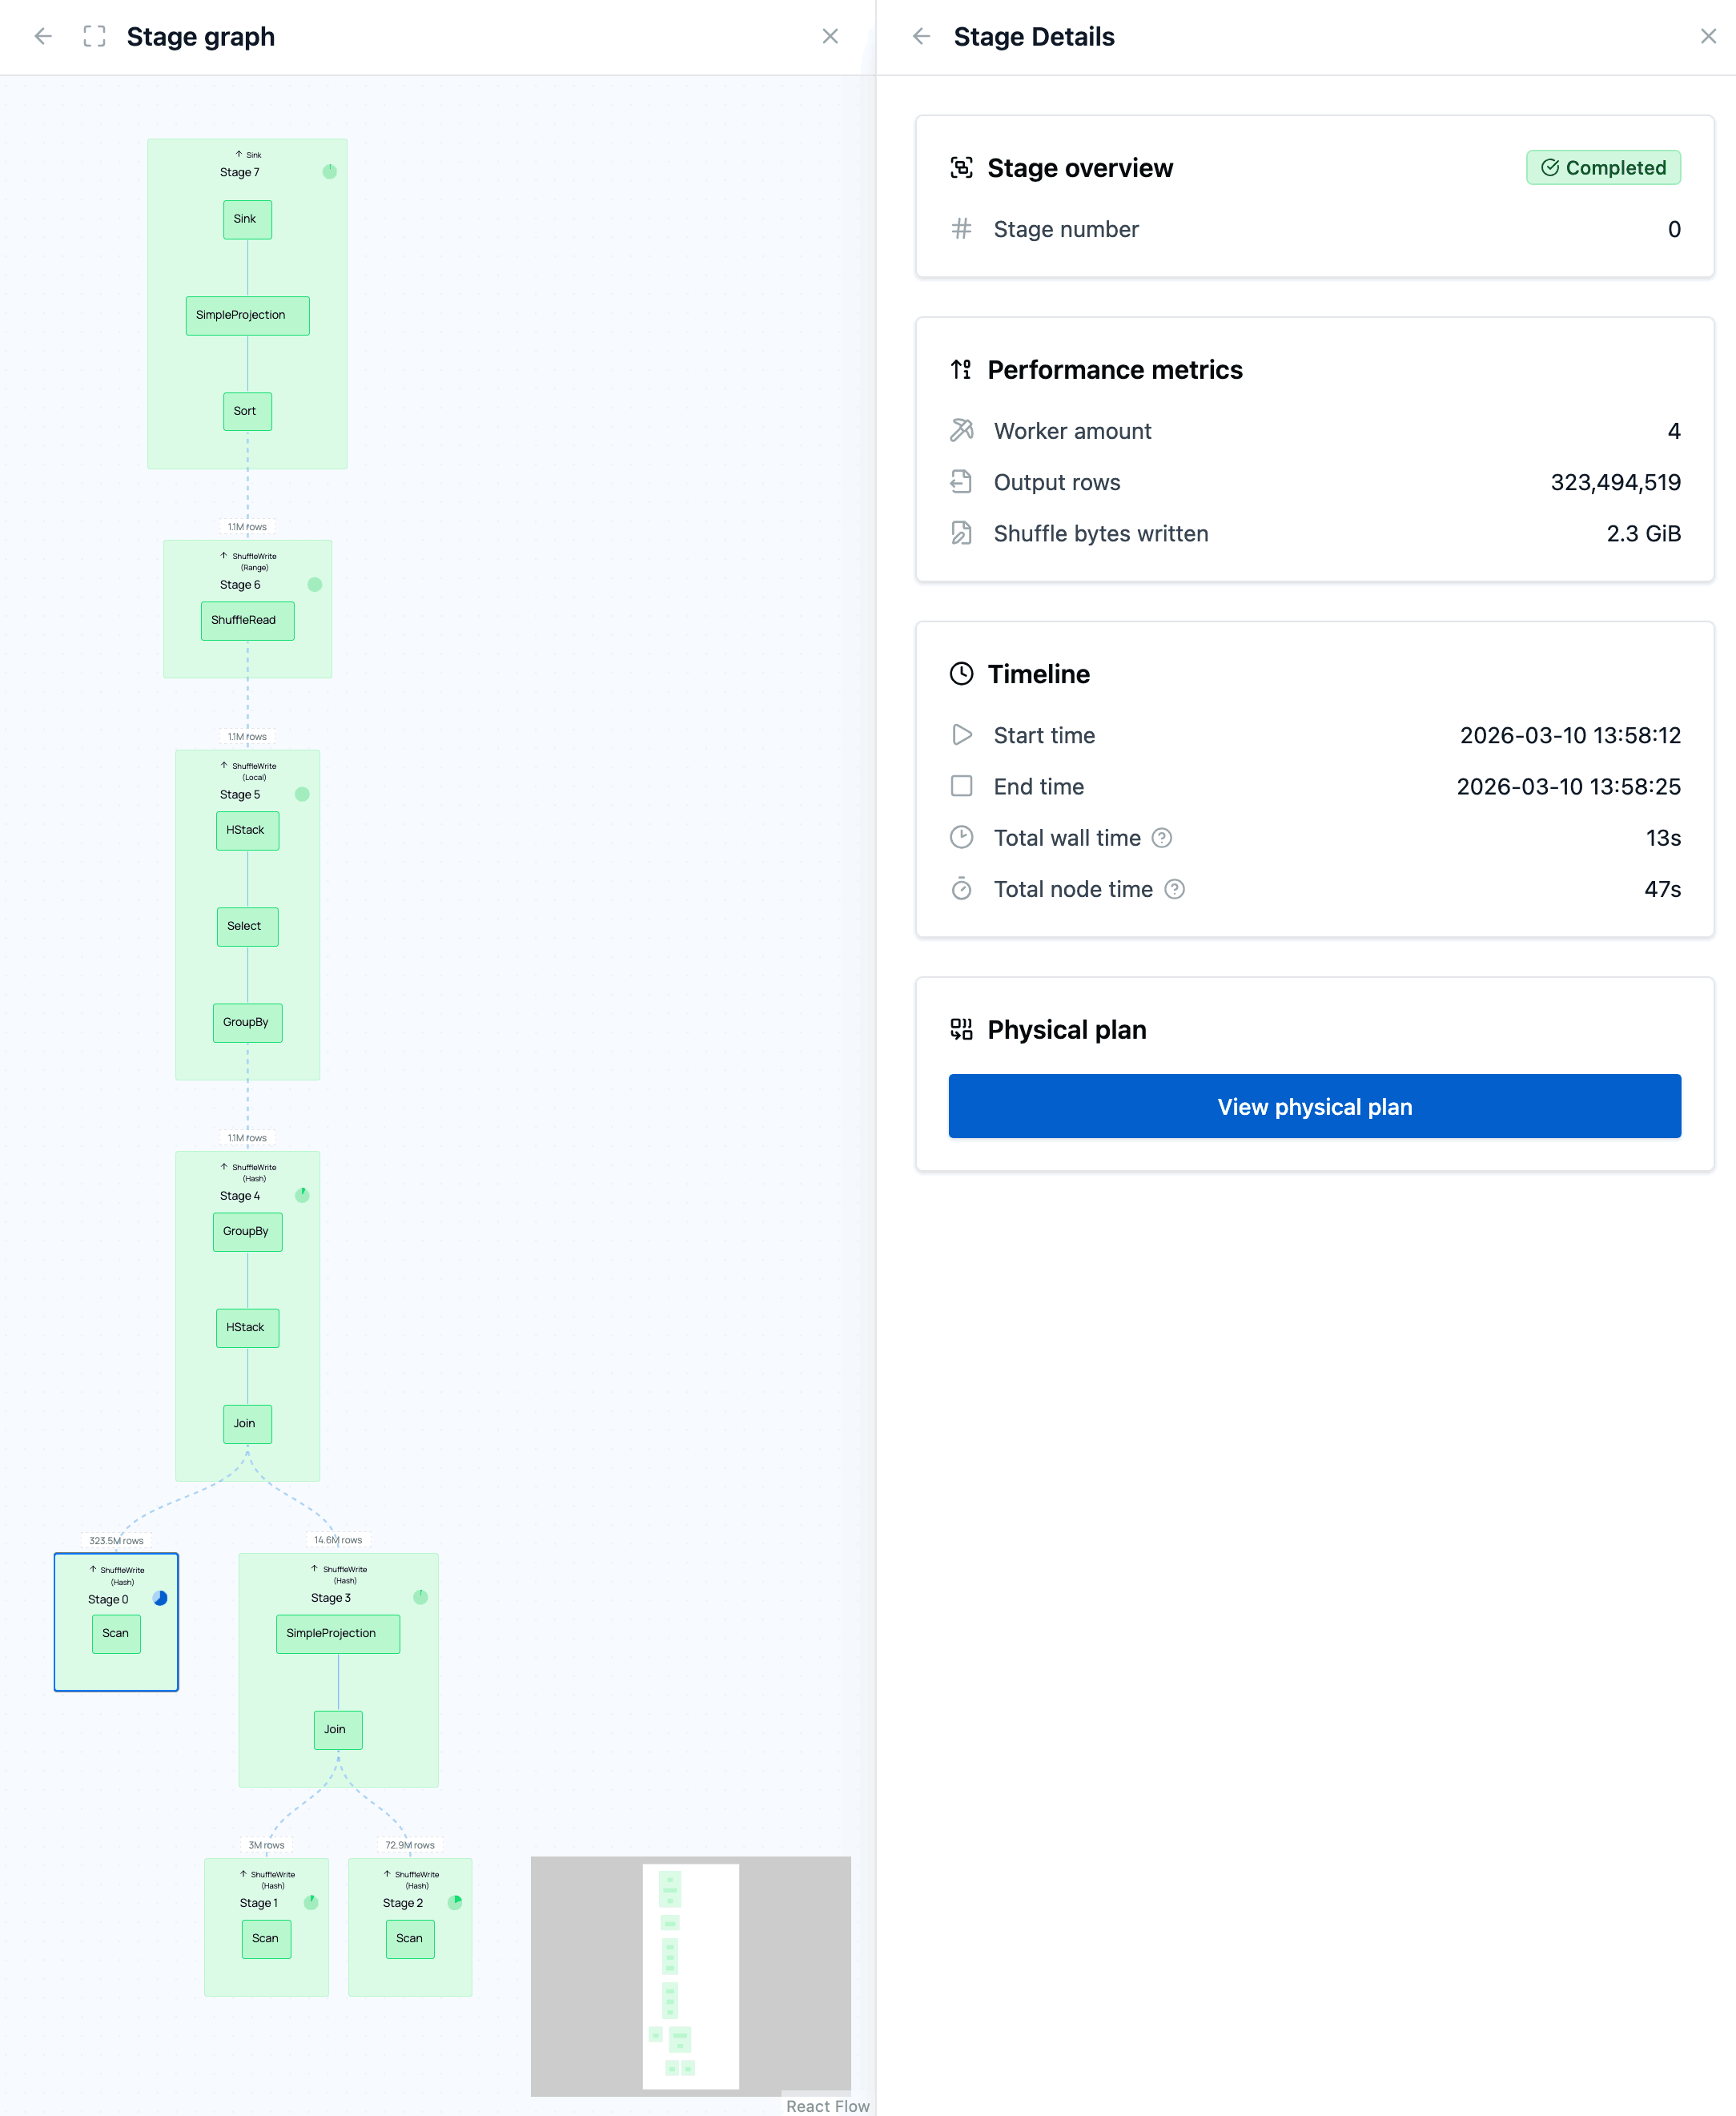
Clicking that stage (not one of the nodes in it) opens the stage details with detailed metrics. The I/O time of this stage is roughly 55%.
The details open the physical plan of this stage. It displays all of the operations in this stage, how long they took, and any indicators that point at bottlenecks.
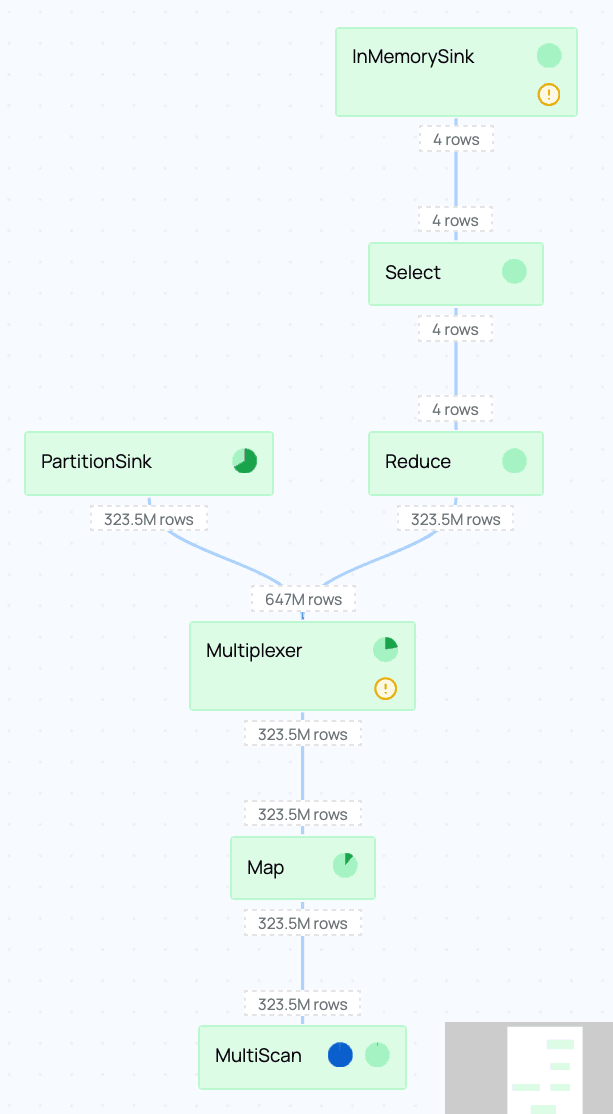
The MultiScan node at the bottom takes almost 100% of the time for I/O:
This I/O indicator shows that I/O was active for nearly the full runtime of the stage. The network I/O in this node is the bottleneck in this part of the physical plan.
In this example the data is stored in us-east-2 while the cluster runs in eu-west-1. The
cross-region bandwidth causes I/O to take longer than it would if the data and cluster were in the
same region. Co-locate the cluster and the data in the same region to minimize I/O latency.
Takeaways
- The logical plan shows how the optimizer rewrote the query.
- The physical plan shows which operations ran and how much CPU and I/O time each is responsible for.
- The stage graph shows which stages of a distributed query take the longest and how much data is shuffled between them.
- Indicators on stages and nodes highlight potential bottlenecks: start with the slowest stage and drill down to individual operations.
- An I/O-heavy query needs more bandwidth: add nodes or choose a higher-bandwidth instance type, and co-locate data and cluster in one region.
- A shuffle-heavy query needs fewer, larger nodes to reduce inter-node traffic.