Quickstart without infrastructure
You don't need any infrastructure to start with Polars Nanook. Install the client and sign up, and the queries you run on your own machine show up in the portal with a full profile. Invite your team to the same workspace to share them. When a query outgrows your machine, or you want Polars Nanook to start machines for you, connect a deployment in your infrastructure.
How do I install the client?
Install the open-source Polars library and the polars-nanook package in your environment:
pip install polars polars-nanook
The package includes the nanook command line tool.
How do I sign up?
Sign up at nanook.pola.rs, or run nanook authenticate, which opens the
same page in your browser. Polars Nanook creates a default organization and workspace for you.
Set up an organization lists their names and how to rename them.
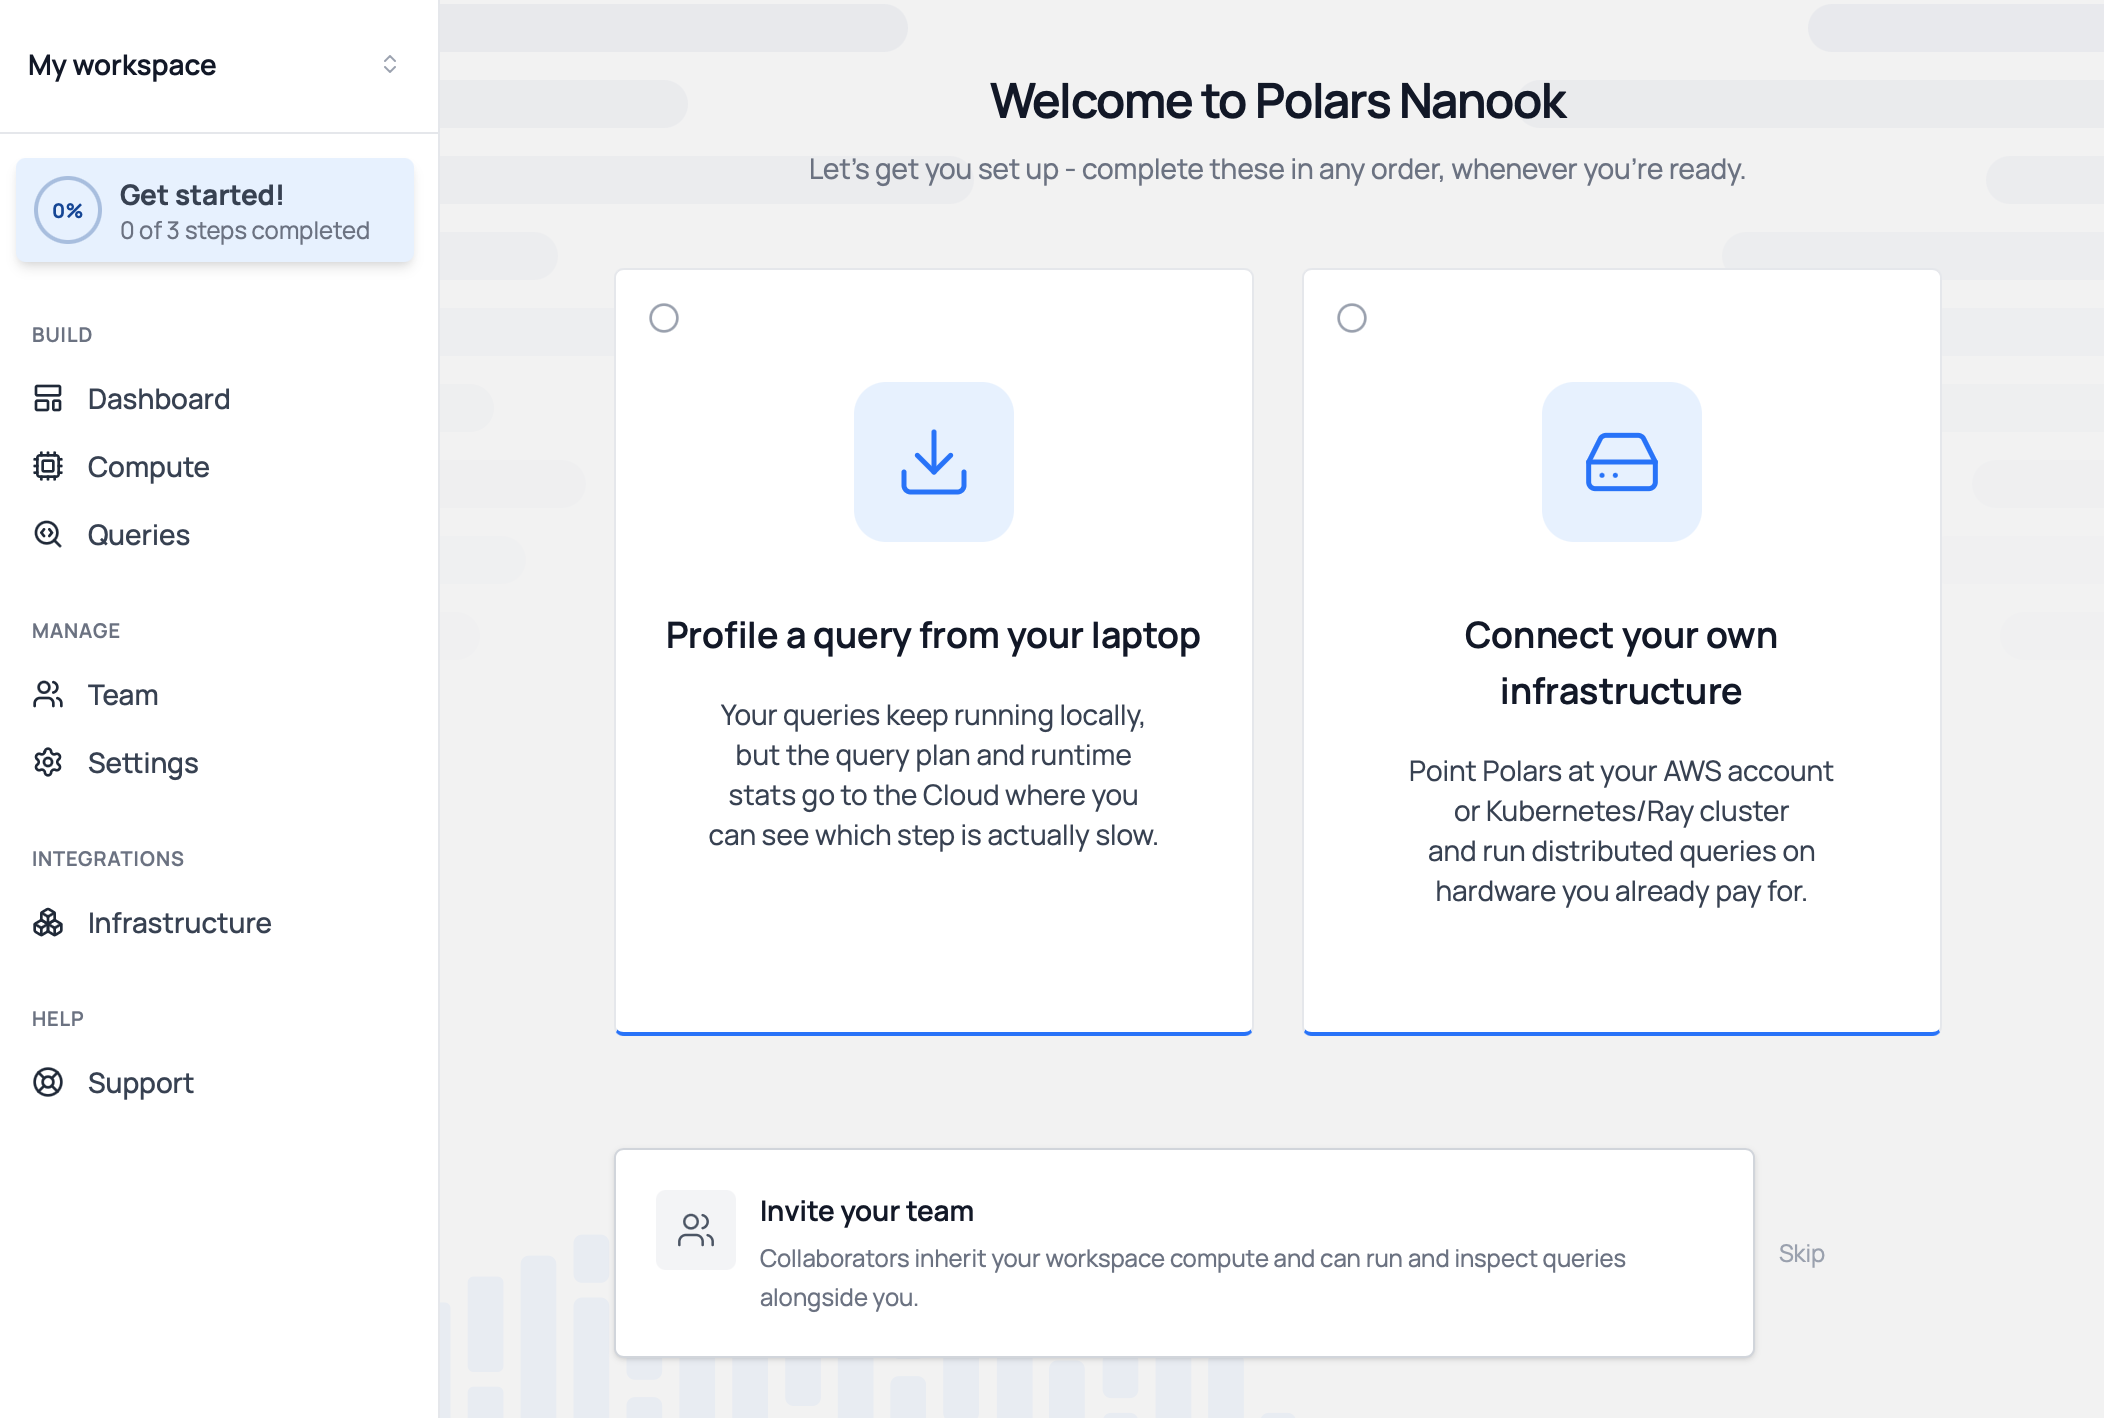
The portal opens on a welcome page with three steps: profile a query, connect your infrastructure and invite your team. Complete them in any order. The Get started! card in the sidebar tracks your progress.
How do I profile a query on my own machine?
Add
pl.Config.enable_monitoring()
above a lazy query and run it as usual. This example runs on its own:
import polars as pl
import polars_nanook as pn

pn.authenticate()

pl.Config.enable_monitoring()

print(
    pl.LazyFrame(
        {
            "quantity": [1, 2, 3, 4, 3],
            "price": [34.2, 43.2, 123.1, 23.3, 42],
            "order_id": [1, 1, 2, 2, 2],
        }
    )
    .group_by("order_id")
    .agg((pl.col("quantity") * pl.col("price")).sum())
    .collect()
)
The query still runs locally. Polars sends the query plan and per-operator runtime stats to your workspace, where the profiler shows which step is slow. Open the query from the Queries tab of your workspace to see the profile.
pl.Config.enable_monitoring(workspace=...) sends profiles to a workspace other than your default.
Monitoring runs queries on the streaming engine, which collects the per-operator metrics.
How do I invite my team?
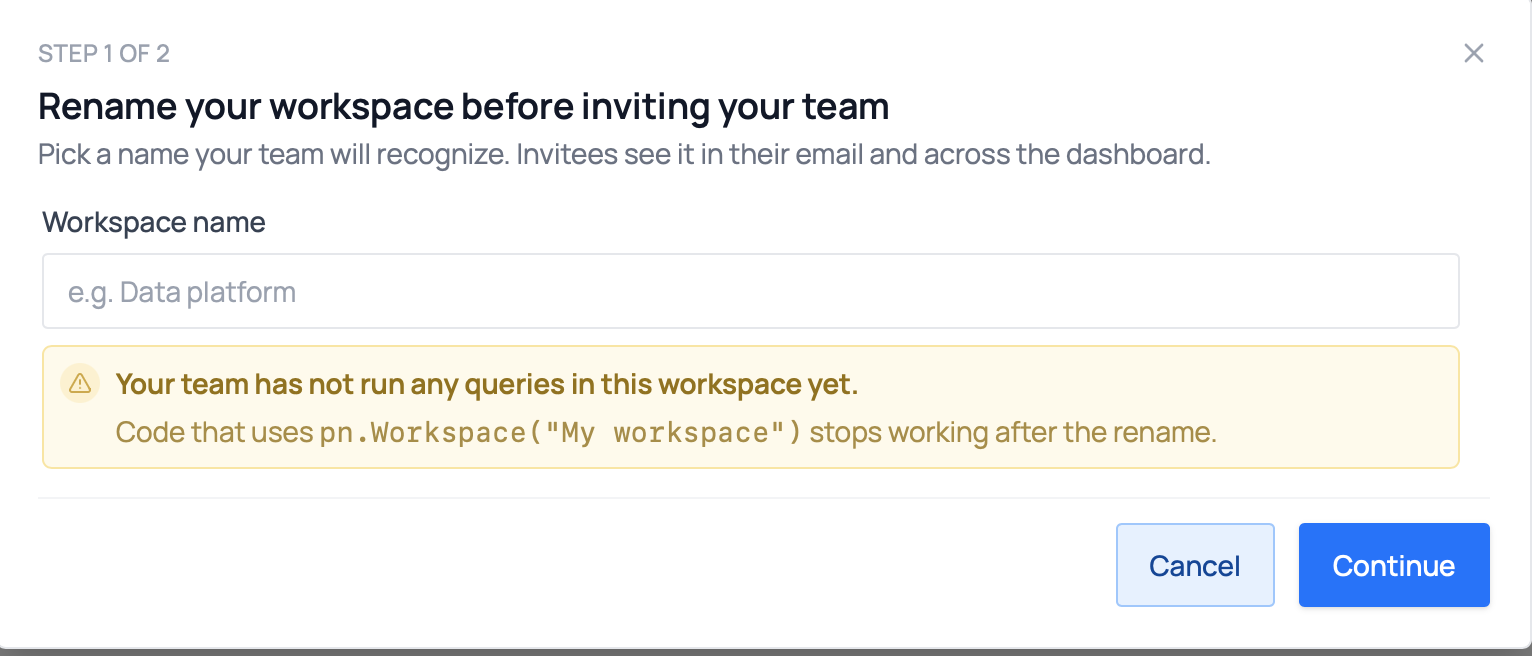
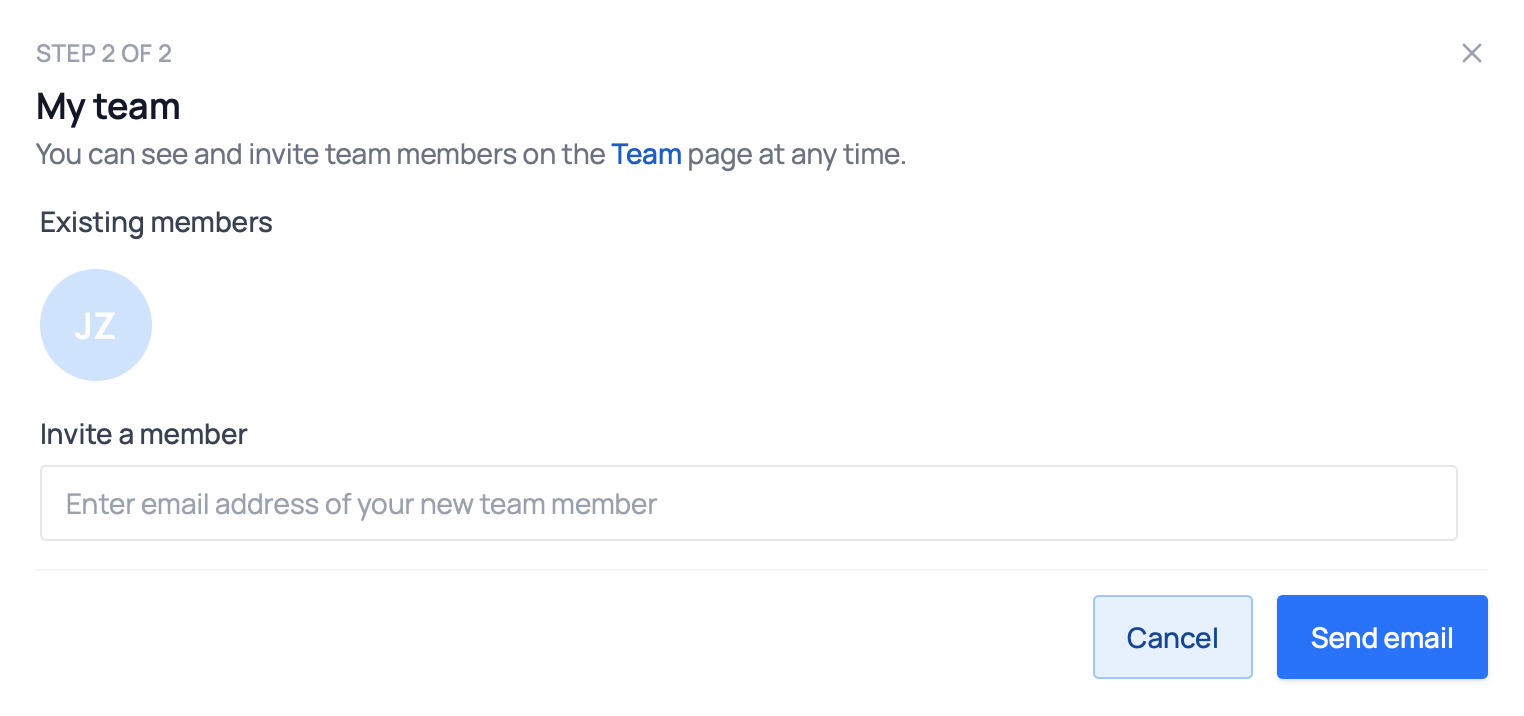
An organization admin invites colleagues to the workspace by email from the Invite your team card on the welcome page or from the Team page in the sidebar. While the workspace still has its default name, the dialog first asks you to rename it.
Members can inspect every query profile in the workspace, including profiles of local queries other
members sent with enable_monitoring(). See the team page for
workspace roles and organization members for access at the
organization level.
How do I run queries in my infrastructure?
Connect a deployment to the workspace, and remote queries run on compute in your infrastructure. Choose a deployment compares the deployments.
-
AWS
Polars Nanook starts EC2 instances in your AWS account on demand, through a CloudFormation stack you deploy once.
-
Helm chart
A cluster you run on EKS, GKE, AKS or any CNCF-conformant distribution, installed with the Helm chart.
-
Bare-metal
A cluster you run on your own servers, from the
polars-nanook-computepackage and one TOML file.
One-time workspace setup
You connect a deployment once per workspace. Members you invite to a connected workspace can run remote queries right away, without any setup of their own.
Next steps
- Learn how to run queries remotely and handle results
- Profile your queries to see where a query spends its time
- Read the FAQ for common questions